Weather
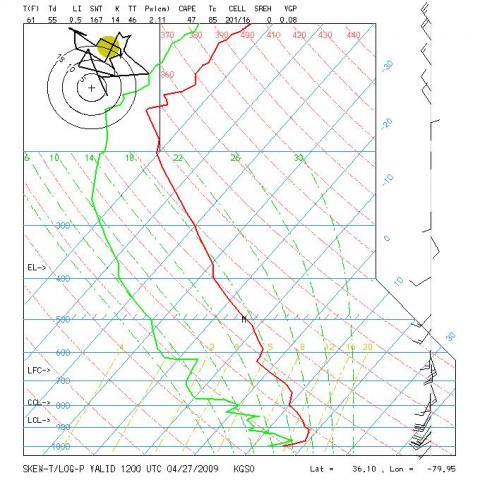
Sounding from Greensboro, NC, at 8am on 27 April 2009
Atmospheric temperature and dewpoint trace from Greensboro, NC, at 8am on 27 April 2009. In this plots, the vertical axis is the atmospheric pressure level (for our purposes, the altitude) and the x-axis is a skewed plot of temperature. The red line on the right starts out near 11°C (55°F) but almost immediately juts out to the right, indicating warming with height. Around 950 mb or so (just a couple thousand feet off the ground), it turns back toward the left, meaning the atmosphere is cooling with height again. (Courtesy: UCAR)