
I'm a week or so late posting this, but as we're about to finally warm up a little after 17 straight days with high temperatures in the Triangle area below the seasonal norm (55 on Dec. 27 was the last time we pushed above normal, and we should do it again, finally, on Jan. 14), I thought I'd take a quick look back at a couple of statistics from the Raleigh-Durham airport for 2009, as that year begins to recede in the rear-view mirror.
While the complete, quality-controlled climate data for the year isn't yet published, I tabulated the numbers for temperature and precipitation based on monthly records, and came up with an average temperature for the year of about 61.3 degrees Fahrenheit. This is 1.7 degrees above the 30-year "normal" value of 59.6, for a warmer-than-normal year overall. It may not seem like a large difference from normal, but it's worth noting that for the current "normal" base period of 1971-2000, our coldest yearly average was 58.3 degrees and the warmest 62.8, with a standard deviation of +/-1.1 degrees.
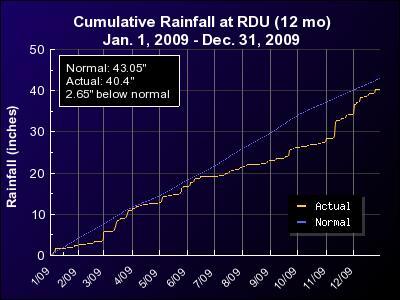
When it comes to precipitation, we really had some significant dry streaks and wet streaks, as you'll see in the first graph, which shows cumulative rainfall versus normal through the year. After a dry couple of months to start the year, we ran normal to above normal out through mid-June or so, before the tap just about cut off and a very dry stretch ensued that lasted right through October. You might recall that at that point, we were trending toward a possible "driest ever" year at RDU. A more active pattern that included some major rain storms in November and December, however, pulled us sharply back from that brink, and in the end the yearly total precipitation (including rain and the liquid equivalent of snow) reached 40.43 inches, or 2.62 inches below normal. That's well within the typical year-to-year variation for RDU, where the standard deviation of annual rainfall is +/-6.4 inches, meaning we receive between roughly 37 and 49 inches of rain almost 70 percent of the time.
The effect of the rain pattern you see on that first graph shows up in stored water at Falls Lake through the year, as seen in the second graph. It shows the lake level holding at or above the normal or "guide" value of 251.5 feet through late June. Then, as the very dry stretch through much of summer combined with elevated evaporation and usage rates, along with depleted stream flows and runoff, the level fell steadily until it was around 3.5 feet below normal by early November. The big rains that followed boosted it rapidly, though, as we finished out the year.
Of course, conditions at a single point like the airport don't always represent our entire viewing area. For a sense of how precipitation for the year varied across the state, I've included three images from the National Weather Service's Precipitation Analysis Web site. First is a contour map showing total precipitation for the year, estimated using a combination of precipitation gages and radar data. After that is a map of precipitation departures from normal in inches, and a third map showing the percentage of normal. The totals map shows much of central NC in the 40-50 inch category, with some of our southern areas in the 30-40 inch range. Totals were a little higher near the coast and over some western parts of the state, and there were some southern mountain areas that topped 80 inches, though it's worth noting a few spots in that part of the state average more than 90 inches per year.
When you look at the anomaly and percentage maps, it is a little clearer how roughly the southern half of our viewing area remained quite dry despite the late-year rains, with some sizable pockets of Johnston, Harnett, Cumberland, Hoke and Moore counties showing the red color indicating totals of 12 inches or more below normal, and notable parts of those counties and several others in the orange contour representing an 8-inch or greater deficit.
Copyright 2024 by Capitol Broadcasting Company. All rights reserved. This material may not be published, broadcast, rewritten or redistributed.


