
... Or, for many areas, the lack therof under the current drought pattern. Tracking drought conditions can be a complex task, as a simple rainfall record for a single station or two doesn't always capture the whole story, since rainfall can be highly variable from place to place. For that reason, the groups that assess drought status across the country take into account long and short-term precipitation patterns (based on radar, satellite and gauge measurements), temperature and evaporation trends, water use demands, reservoir level, groundwater and streamflow trends, and more in classifying various locations. Those analyses have recently put most of our viewing area under the severe drought category, with parts of Hoke, Harnett, Chatham and Moore counties in the extreme drought category, and southwestern NC, including the southern mountains, now under the highest drought classification used by the U.S. Drought Monitor, exceptional drought. In fact, a summary included with the weekly drought monitor update includes a mention of fires that are underway in parts of the southern mountains, where normally "peat-like," moist soils are so dry that the ground itself is burning and very difficult to extinguish.
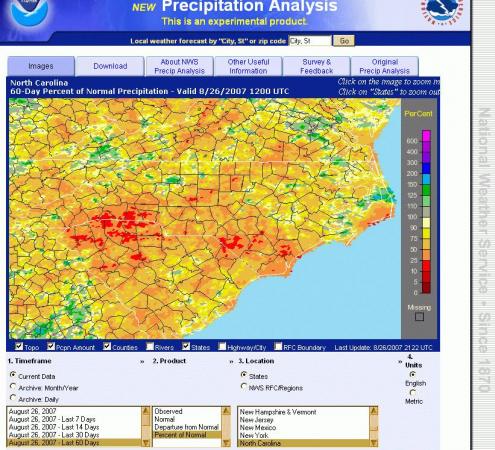
One nice resource for tracking the precipitation part of the overall drought picture is a web site that the National Weather Service has developed that provides a visualization of rainfall totals over a variety of user-selectable time spans, and includes the ability to compare the observed rainfall against the "normal" values, and also to visualize the rainfall departure from normal in terms of an absolute difference and in terms of the percentage of normal rainfall over a specified time period. The site is organized very nicely so that the user can quickly compare values over a range of time frames, for example a look at the amount of rain that has fallen in the past 30 days or the past 90 days, or a map of what percentage of normal rain has fallen since the beginning of the calendar year or over the past 60 days. That last variable is the one shown in the sample map I posted above, and readily indicates that much of our state has received less than 50 percent of normal rainfall for the past two months, with several areas (in red) at 10-25% of normal. There are a few small pockets with more than normal rainfall for that period, southern Wake County and an east-west band across the Rocky Mount area being two examples.
For a look at the Precipitation Analysis Page just go to
http://www.srh.noaa.gov/rfcshare/precip_analysis_new.php
and click on our state to zoom in on North Carolina. There you can add or subtract map features like rivers, county outlines, city names and more. Just clicking on the various parameters you'd like to see should make them immediately appear on the map.
Copyright 2024 by Capitol Broadcasting Company. All rights reserved. This material may not be published, broadcast, rewritten or redistributed.


