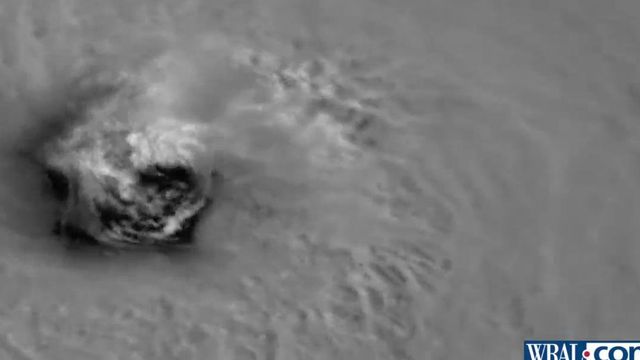
Satellites being used to improve weather forecasting
Carolinians know all to well that the effects of a storm don't stop once the winds have died down, and neither does the forecasting.
Posted — UpdatedCarolinians know all to well that the effects of a storm don’t stop once the winds have died down, and neither does the forecasting.
Missions large and small, are making possible better forecasting of when and where the storm will arrive and the flooding it leaves behind.
Beyond weather satellites like GOES-16, a fleet of NASA and other agency satellites studied Florence from formation to aftermath. That data aids in prediction and response, especially to flooding.
Scientists also discovered the technology can detect standing water and soil moisture to help produce high resolution flood inundation maps. CYGNSS was first used to map flooding in Texas and Cuba after Hurricanes Harvey and Irma in 2017.
Temporal Experiment for Storms and Tropical Systems Demonstration (TEMPEST-D), was deployed from the International Space Station in May. This cereal box sized satellite measures clouds, ice and precipitation within storms globally. Taking these measurements frequently over time enables a better understanding of how these storms form and evolve from their birthplace off the coast of Africa until they reach our shores.
The same program that provided the images on the giant globe outside the North Carolina Museum of Natural Sciences is helping first responders and other local agencies across the Carolinas respond to flooding. NASA’s Operational Land Imager (OLI) on the Landsat 8 satellite captured the extent of devastating flooding along the Haw and Trent rivers.
The Trent River, one of 16 North Carolina rivers that reached major flood stage, was measured at an all-time high of 29 feet on September 17, twice flood stage. The impact is clear in Landsat 8 images.
LandSat images also revealed soil, sediment, decaying leaves, pollution, and other debris in rivers, as well as the nearshore ocean. Monitoring will continue for impact on drinking water and aquatic ecosystems.
Uninhabited Aerial Vehicle Synthetic Aperture Radar (UAVSAR) flies a hyper-accurate path gathering information about the surface area and depth of floods from a pod filled with radars, slung beneath NASA Gulfstream-III. This reveals flooded areas not otherwise visible from the air. Remotely sensed observations like these extend beyond areas measured by USGS flood gauges but most importantly show how conditions change over the days following the storm. This provides critical information to emergency management officials they can use in deciding which areas need to be evacuated and when.
This data helped forecasters get a lot of things about Florence right, The center of the cone of uncertainty in The National Hurricane Center’s forecast issued five days before Florence made landfall was just 2 miles off. Emphasis on the primary impact of this storm being flooding have proven correct as well.
However, the computer models used to forecast the storm didn't incorporate whatever caused the storm to weaken as it got closer to shore. Drier air off the Carolina coast is the likely culprit, but this is difficult to detect and how much dry air is needed to disrupt a storm is not yet well understood. Data from these and other Earth observing missions will help improve those models and the predictions they produce.
Related Topics
• Credits
Copyright 2024 by Capitol Broadcasting Company. All rights reserved. This material may not be published, broadcast, rewritten or redistributed.


