Average Household Credit Card Debt in the U.S. in 2018
In this analysis we’ll cover: Credit Card Debt in the U.S. — By the Numbers Credit Card Balances vs. Household Credit Debt How We Calculated Household Credit Card Debt Do We Know What We Owe? Are We Paying Down Credit Debt? Credit Debt Burden by Income Generational Differences in Credit Card Use How Does Your State Compare? … Continue reading Average Household Credit Card Debt in the U.S. in 2018The post Average Household Credit Card Debt in the U.S. in 2018 appeared first on MagnifyMoney.
Posted — Updated
In this analysis we’ll cover:
Credit Card Debt in the U.S. — By the Numbers
- Credit Card Balances vs. Household Credit Debt
- How We Calculated Household Credit Card Debt
Do We Know What We Owe?
- Are We Paying Down Credit Debt?
- Credit Debt Burden by Income
- Generational Differences in Credit Card Use
How Does Your State Compare?
- Average Credit Card Debt by State
- Average Delinquency Rate by State
Even as household income and employment rates are ticking up in the U.S., credit card balances are approaching all-time highs. What’s behind the growth of credit card spending among consumers? In an updated report on credit card debt in America, MagnifyMoney analyzed credit debt trends in the U.S. to find out exactly how much credit debt consumers are really taking on and, crucially, how they are managing their growing reliance on plastic.
Key Insights:
- Credit card debt is on the rise with the average indebted household carrying $8,683 in credit card debt. That’s an increase of more than $650 per household compared with this time last year — a full 8.6 percent increase. Despite the rise in debt levels, current debt levels are 22.8 percent less compared with October 2008, when household credit card debt peaked at $11,248.
- Credit card balances and credit card debt are not the same thing. The 78 million Americans who pay their bill in full each month have credit card balances reported to the major credit reporting bureaus.
- Assessing financial health means focusing on credit card debt trends rather than credit card use trends.
Credit Card Debt in the U.S. — By the Numbers
Credit Card Use
- Number of Americans who use credit cards: 200 million1
- Average number of credit cards per consumer: 2.32
- Number of Americans who carry credit card debt: 122 million3
Credit Card Debt
The following figures only include the credit card balances of those who carry credit card debt from month to month.
- Total credit card debt in the U.S.: $542 billion4
- Average credit card debt per person: $4,4535
- Average credit card debt per household: $8,6836
Credit Card Balances
The following figures include the credit card statement balances of all credit card users, including those who pay their bill in full each month.
- Total credit card balances: $808 billion as of July 2017, an increase of 8.1 percent from the previous year.7
- Average balance per person: $4,0418
Who Pays Off Their Credit Card Bills?
- 45 percent of households pay off their credit card bills in full each month
- 28 percent of households carry a balance all year
- 26 percent of households sometimes carry a balance9
Credit Card Balances vs. Household Credit Debt
At first glance, it may seem that Americans are taking on near record levels of credit debt. Over a quarter (28 percent) of American households9 carry credit card debt from month to month, and another quarter (26 percent) carried credit card debt at least once last year.
If you look at the total credit card balances among U.S. households, the figure appears astronomical — $808 billion. But that figure includes households that are paying their credit debt in full each month as well as those that are carrying a balance from month to month.
While credit balances are increasing, the amount of debt that households are carrying from month to month is somewhat lower than it was leading up to the 2008 financial crisis. The total of credit card balances for households that actually carry debt from month to month is $542 billion.
As of the third quarter of 2017, households with credit card debt owed an average of $8,6833 That is a decrease of 22.8 percent compared to October 2008, when household credit card debt peaked at $11,248.10J
And as household incomes have risen in recent years, this has helped to lower the ratio of credit card debt to income. Today, indebted households with average debt and median household incomes have a credit card debt to income ratio of 14.7 percent.11 Back in 2008, the ratio was 20.1 percent12.
Delinquency Rates
Credit card debt becomes delinquent when a bank reports a missed payment to the major credit reporting bureaus. Banks typically don’t report a missed payment until a person is at least 30 days late in paying. When a consumer doesn’t pay for at least 90 days, the credit card balance becomes seriously delinquent. Banks are very likely to take a total loss on seriously delinquent balances.
In the second quarter of 2010, serious delinquency rates on credit cards were 13.74 percent of all balances owed, nearly twice as what they are today. Today, credit card delinquency rates are down to 7.47 percent.13
How We Calculated Household Credit Card Debt
Credit card debt doesn’t appear on the precipice of disaster, but the recent growth in balances is cause for some concern. Still, our estimates for household credit card debt remain modest.
In fact, MagnifyMoney’s estimates of household credit card debt is two-thirds that of other leading financial journals. Why are our estimates comparatively low?
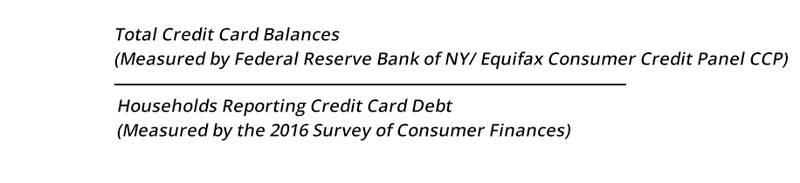
A common estimate of household credit card debt is:
This method overstates credit card debt. The Federal Reserve Bank of New York/Equifax Consumer Credit Panel (CCP) does not release a figure called credit card indebtedness. Instead, they release a figure on national credit card balances. Representatives of the Federal Reserve Bank of New York and the Philadelphia Federal Reserve Bank both confirmed that the CCP includes the statement balances of people who go on to pay their bills in full each month.
To find a better estimate of credit card debt, we found methods to exclude the statement balances of full paying households from our credit card debt estimates. Statement balances are the balances owed to a credit card company at the end of a billing cycle. Even though full payers pay off their statement balance each month, their balances are included in the CCP’s figures on credit card balances.
Our credit card debt estimate is:3
Per Person Credit Card Debt
Once we adjust for these effects, we see that an estimated 122 million Americans carry $542 billion of credit card debt from month to month. Back in 2008, 20 million fewer Americans carried debt, but total credit card debt in late 2008 hovered around $589 billion.16 That means people with credit card debt in 2008 had far more debt than people with credit card debt today.
Average credit card debt among those who carry a balance today is $4,453 per person2 or $8,683 per household.3 In late 2008, the 102 million17 Americans with credit card debt owed an average of $5,858 per person10I or $11,248 per household.10J
Credit Card Debt: Do We Know What We Owe?
Academic papers, consumer finance surveys, and the CCP each use different methods to measure average credit card debt among credit card revolvers. Since methodologies vary, credit card debt statistics vary based on the source consulted.
MagnifyMoney surveyed these sources to present a range of credit card debt statistics.
Low Estimate
High Estimate
People with Credit Card Debt
110 million18A
134 million18B
Households with Credit Card Debt
55 million19
69 million20
Median Household Credit Card Debt
$2,30021
Average Household Credit Card Debt
$5,70023
$9,60024
MagnifyMoney Estimated Credit Card Debt per Person
$4,3515
$4,5555
Are We Paying Down Credit Card Debt?
Academic research shows the conflicting attitude is justified. Some credit card users aggressively pay off debt. Others pay off their bills in full each month.
However, a substantial minority (44 percent)26 of revolvers pay within $50 of their minimum payment. Minimum payers are at a high risk of carrying unsustainable credit card balances with high interest.
In fact, 14 percent of consumers have credit card balances above $10,000.27 At current rates, consumers with balances of $10,000 will spend close to $1,500 per year on interest charges alone.28
Even an average revolver will spend between $65230 and $68331 on credit card interest each year.
Credit Debt Burden by Income
Those with the highest credit card debts aren’t necessarily the most financially insecure. According to the 2016 Survey of Consumer Finances, the top 10 percent of income earners who carried credit card debt had nearly twice as much debt as average.
However, people with lower incomes have more burdensome credit card debt loads. Consumers in the lowest earning quintile had an average credit card debt of $2,100. However, their debt-to-income ratio was 13.9 percent. On the high end, earners in the top decile had an average of $12,500 in credit card debt. But debt-to-income ratio was just 4.8 percent.
.txtleft{float:left; width:70%;}.imgright{float:right; width:30%; text-align;text-align: right;} Income Percentile
Median Income
Average CC Debt
CC Debt: Income Ratio
0%-20%
$15,100
$2,100
13.9%
20%-40%
$31,400
$3,800
12.1%
40%-60%
$52,700
$4,400
8.3%
60%-80%
$86,100
$6,800
7.9%
80%-90%
$136,000
$8,700
6.4%
90%-100%
$260,200
$12,500
4.8%
Generational Differences in Credit Card Use
In 2017, Generation X surpassed the baby boomer generation to have the highest credit card balances. Experian estimates that on average, Generation X has a balance of $7,750 per person, 21.94% more than the national average ($6,354). Boomers carry nearly as much as Generation X with an average balance of $7,550.
At the other end of the spectrum, millennials, who are often characterized as frivolous spenders and are too quick to take on debt, have nearly the lowest credit card balances. Their median balance clocks in at $4,315. The youngest generation, Gen Z, has the smallest average balance of $2,047 per person.34
Better Consumer Behavior Driving Bank Profitability
You may think that lower balances spell bad news for banks, but that isn’t the case. Credit card lending is more profitable than ever thanks to steadily declining credit card delinquency. Credit card delinquency is near an all-time low 7.47 percent.13
Despite better borrowing behavior, banks held interest on credit cards steady between 13% and 14%35 since 2010. Today, interest rates on credit accounts (assessed interest) is nearly 15%. This means bank profits on credit cards are at all-time highs. In 2015, banks earned over $102 billion dollars from credit card interest and fees.36 This is 15 percent more than banks earned in 2010.
How Does Your State Compare?
Using data from the Federal Reserve Bank of New York Consumer Credit Panel and Equifax, you can compare median credit card balances and credit card delinquency. You can even see how each generation in your state compares with the national median.
State
Credit Card Debt Per Debtor
Credit Card Debt Per House
Alabama
$3,710.56
$7,198.48
Alaska
$5,879.85
$11,406.91
Arizona
$4,299.70
$8,341.42
Arkansas
$3,289.01
$6,380.69
California
$4,569.51
$8,864.85
Colorado
$4,898.56
$9,503.20
Connecticut
$5,171.89
$10,033.47
Delaware
$4,338.88
$8,417.42
Florida
$4,318.35
$8,377.59
Georgia
$4,727.46
$9,171.27
Hawaii
$5,330.46
$10,341.09
Idaho
$3,791.84
$7,356.18
Illinois
$4,412.71
$8,560.65
Indiana
$3,624.05
$7,030.65
Iowa
$3,169.16
$6,148.17
Kansas
$3,854.05
$7,476.85
Kentucky
$3,457.67
$6,707.88
Louisiana
$3,767.91
$7,309.75
Maine
$3,905.56
$7,576.78
Maryland
$5,287.61
$10,257.96
Massachusetts
$4,720.53
$9,157.83
Michigan
$3,458.51
$6,709.51
Minnesota
$4,257.26
$8,259.08
Mississippi
$3,204.95
$6,217.60
Missouri
$3,763.46
$7,301.11
Montana
$3,732.83
$7,241.69
Nebraska
$3,594.46
$6,973.25
Nevada
$4,263.19
$8,270.59
New Hampshire
$4,943.44
$9,590.27
New Jersey
$5,361.06
$10,400.47
New Mexico
$4,185.93
$8,120.71
New York
$4,969.84
$9,641.50
North Carolina
$4,124.04
$8,000.63
North Dakota
$3,756.19
$7,287.00
Ohio
$3,738.95
$7,253.56
Oklahoma
$4,038.90
$7,835.47
Oregon
$3,881.17
$7,529.48
Pennsylvania
$4,209.21
$8,165.86
Rhode Island
$4,376.34
$8,490.10
South Carolina
$4,187.65
$8,124.04
South Dakota
$3,608.28
$7,000.07
Tennessee
$3,903.24
$7,572.28
Texas
$4,937.00
$9,577.78
Utah
$3,775.21
$7,323.92
Vermont
$4,199.77
$8,147.56
Virginia
$5,404.32
$10,484.38
Washington
$4,568.09
$8,862.09
West Virginia
$3,381.36
$6,559.84
Wisconsin
$3,410.29
$6,615.96
Wyoming
$3,944.72
$7,652.76
Delinquency Rate
Alaska
11.3%
Alabama
8.5%
Arkansas
9.1%
Arizona
10%
California
8.1%
Colorado
6.9%
Connecticut
7.3%
Delaware
10.4%
Florida
10.8%
Georgia
10.8%
Hawaii
6.5%
Iowa
6.7%
Idaho
6.9%
Illinois
7.3%
Indiana
6%
Kansas
6.5%
Kentucky
8.7%
Louisiana
10.2%
Massachusetts
6.9%
Maryland
8.5%
Maine
7%
Michigan
7.2%
Minnesota
5.3%
Missouri
12%
Mississippi
7.9%
Montana
6%
North Carolina
7.36%
North Dakota
4.22%
Nebraska
4.82%
New Hampshire
6.07%
New Jersey
7.20%
New Mexico
8.32%
Nevada
9.88%
New York
8.22%
Ohio
6.81%
Oklahoma
7.22%
Oregon
6.08%
Pennsylvania
7.05%
Rhode Island
7.06%
South Carolina
7.65%
South Dakota
5.73%
Tennessee
6.67%
Texas
7.84%
Utah
5.56%
Virginia
5.87%
Vermont
5.46%
Washington
5.36%
Wisconsin
4.47%
West Virginia
7.34%
Wyoming
6.49%
Silent
Boomers
Gen X
Millennials
Gen Z
Alaska
$5,456
$9,495
$8,995
$4,464
$1,518
Alabama
$3,511
$6,461
$6,485
$3,324
$1,455
Arkansas
$3,194
$5,995
$6,197
$3,240
$1,803
Arizona
$4,149
$6,967
$6,778
$3,575
$1,555
California
$4,232
$7,050
$6,578
$3,654
$1,596
Colorado
$4,004
$7,499
$7,439
$3,833
$1,514
Connecticut
$4,091
$8,179
$8,046
$3,716
$2,567
Dist. of Columbia
$5,486
$7,976
$7,393
$4,596
$2,814
Delaware
$4,147
$7,128
$7,144
$3,285
$1,608
Florida
$4,311
$7,047
$6,615
$3,639
$1,837
Georgia
$4,356
$7,517
$6,972
$3,540
$1,835
Hawaii
$4,386
$7,073
$7,355
$4,203
$1,657
Iowa
$2,367
$5,297
$6,163
$2,857
$935
Idaho
$3,477
$6,147
$6,332
$3,193
$928
Illinois
$3,641
$7,054
$7,040
$3,537
$1,556
Indiana
$3,137
$5,998
$6,174
$3,003
$1,402
Kansas
$3,187
$6,514
$6,930
$3,292
$1,421
Kentucky
$3,044
$5,727
$6,080
$3,082
$1,372
Louisiana
$3,679
$6,598
$6,561
$3,425
$1,971
Massachusetts
$3,481
$7,017
$7,022
$3,479
$1,882
Maryland
$4,341
$7,994
$7,458
$3,671
$1,749
Maine
$3,107
$6,054
$6,531
$3,375
$1,286
Michigan
$3,436
$6,049
$6,113
$2,971
$1,523
Minnesota
$3,025
$6,299
$6,898
$3,244
$1,338
Missouri
$3,265
$6,333
$6,757
$3,279
$1,346
Mississippi
$3,218
$5,634
$5,718
$3,043
$2,011
Montana
$3,285
$5,977
$6,868
$3,385
$1,506
North Carolina
$3,481
$6,566
$6,710
$3,397
$1,486
North Dakota
$2,141
$5,362
$6,646
$3,326
$1,467
Nebraska
$2,717
$5,909
$6,498
$3,136
$1,388
New Hampshire
$3,582
$7,140
$7,443
$3,519
$1,666
New Jersey
$4,126
$8,011
$7,882
$3,928
$2,241
New Mexico
$4,373
$6,906
$6,534
$3,532
$1,207
Nevada
$4,733
$6,993
$6,357
$3,700
$1,185
New York
$3,906
$7,127
$7,234
$3,986
$2,495
Ohio
$3,313
$6,383
$6,530
$3,135
$1,465
Oklahoma
$3,484
$6,789
$6,900
$3,493
$1,641
Oregon
$3,618
$6,502
$6,481
$3,245
$856
Pennsylvania
$3,282
$6,550
$7,059
$3,457
$1,545
Rhode Island
$3,524
$7,162
$7,313
$3,371
$1,786
South Carolina
$4,019
$6,537
$6,559
$3,281
$1,375
South Dakota
$2,584
$5,710
$6,900
$3,250
$1,531
Tennessee
$3,388
$6,309
$6,505
$3,308
$1,737
Texas
$4,350
$7,591
$7,119
$3,779
$1,945
Utah
$3,364
$6,411
$6,713
$3,070
$932
Virginia
$4,132
$7,956
$7,968
$3,985
$1,692
Vermont
$3,681
$6,197
$6,547
$3,297
$2,511
Washington
$3,947
$7,365
$7,190
$3,500
$1,355
Wisconsin
$2,740
$5,673
$6,289
$2,914
$992
West Virginia
$2,914
$5,573
$6,158
$3,238
$1,166
Wyoming
$3,523
$6,356
$6,889
$3,663
$1,442
199 million1 * 67% (Not full payers) b = 134 million people with credit card debt.
194 million1 * 67% (Carried debt at some point last year) * $4,3505d in debt per person = $583 billion in debt
[$808 billion – ($3,412 (full payer balance) * 33% full payer * 199 million credit card users1)] / (199 million credit card users * (100% – 33% not full payers)) = $4,350
$808 billion in outstanding credit card balancesaEstimate that 45% pay balance in full each monthcFull payers carry an average balance of $3412 before paying it offb
[$808 billion – ($3,412 (full payer balance) * 45% full payer * 199 million credit card users1)] / (199 million credit card users * (100% – 45% not full payers)) = $4,555
76.6% of people with credit reports had balances on credit cards in September 2008a x 240 million adults with credit reports in Q3 2008b= 183 million credit card users.
$866 billion in outstanding credit card debt in Q3 2008cAverage balance of $3,412 for “full payers.”f33% full payersf
[$866 billionc – ($3,412f (full payer balance) * 33% full payerf * 183a/b million credit card users)] / (183a/b million credit card users * (100% – 33%f not full payers)) = $5,365
Estimate H:
76.6% of people with credit reports had balances on credit cards in September 2008a x 240 million adults with credit reports in Q3 2008b= 183 million credit card users.
$866 billion in outstanding credit card debt in Q3 2008cAverage balance of $3,412 for “full payers.”d44.5% in debtd
[$866 billion – ($3,412 (full payer balance) * (100% – 44.5% (estimate of full payer)) * 240 million people with credit reports)] / (240 million people with credit reports * (44.5% in debt)) = $6,352
Estimate I:
Average estimated credit card debt per person is $5,858.
Estimate J:
$866 billion in outstanding credit card debt in Q3 2008cAverage balance of $3,412 for “full payers.”d33% full payers, we calculated
$866 billionc – ($3,412d (full payer balance) * 33% full payerd * 183 million credit card usersa/b) = $659 billion
Estimate H:76.6% of people with credit reports had balances on credit cards in September 2008a x 240 million adults with credit reports in Q3 2008b= 183 million credit card users.
$866 billion in outstanding credit card debt in Q3 2008cAverage balance of $3,412 for “full payers.”d44.5% full payerse
$866 billionc – ($3,412d (full payer balance) * 44.5% full payere * 183 million credit card usersa/b) = $518 billion
76.6 percent of the adult population uses credit cardsa X 240 million adults with credit reportsb = 183 million credit card users X 44.5% with debtc = 82 million with credit card debt
76.6% of the adult population uses credit cardsa X 240 million adults with credit reportsb = 183 million credit card users X 67% with debtd = 123 million with credit card debt
Copyright 2024 Magnify Money. All rights reserved.


