Ahead of the official start to summer, 2024 is shaping up to be a scorcher.
All regions in North Carolina are expected to see above-normal temperatures, and Raleigh summers are about 5 degrees now hotter than they were in the 1970s, according to Climate Central.
Other WRAL Top Stories
Extreme heat has gotten so extreme that red is no longer the hottest color on weather maps.
The National Weather Service and Centers for Disease Control have added a new color, magenta, to represent an even more dangerous level of heat as climate change drives more frequent and intense heat waves.
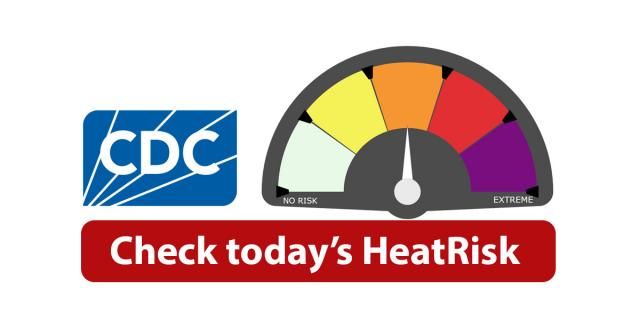
Red now signifies the hottest 5% of days for a particular location, but magenta signifies exceptionally hot and long-lasting heat waves with minimal nighttime relief. These extreme heat events pose a much greater health risk to the public.
Dr. Este Geraghty is chief medical officer for Esri, a company that specializes in geographic information systems used by the White House and cities across the U.S., including Raleigh, to combat extreme heat.
“For some of us, it's just inconvenient and uncomfortable, but some people may develop heat exhaustion, heat, stress, heat stroke ... and beyond that it can make worse conditions like heart disease, hypertension, even mental illness," Geraghty said. "As a physician, the health risks associated with heat are deeply troubling."
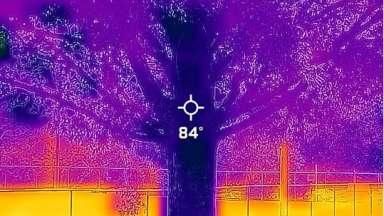
At least 2,300 people died last year from heat-related illness, according to an Associated Press analysis of Centers for Disease Control and Prevention data. That is triple the annual average between 2004 and 2018.
Heat kills more people each year than hurricanes, floods and tornadoes combined, according to the National Weather Service.
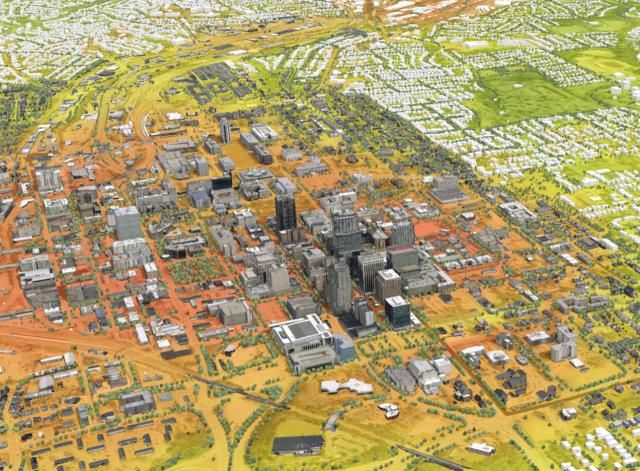
Geraghty says Esri's geographic technology aims to develop specific location intelligence to mitigate risk in the hottest parts of cities.
“You can use the data for an analysis to figure out some of the causes or to predict what the climate is going to look like in the future, then you can start to prioritize your action areas,” Geraghty said.
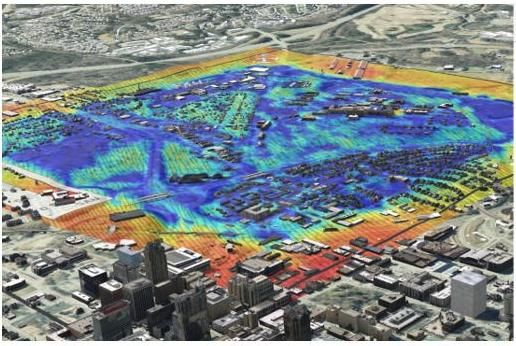
When temperatures soar in cities, paved areas can act like heat magnets called urban heat islands.
The city of Raleigh gathered data in 2021 to map out where these hot zones are located and found areas with roads, buildings and other paved surfaces could be as much as 20 degrees hotter than areas with trees and shade.
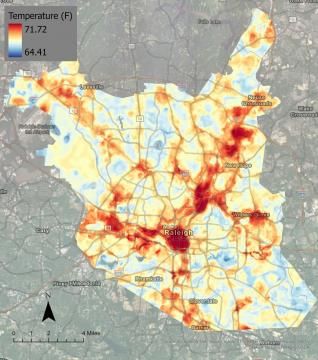
Now, Raleigh planners are learning more about these microclimates using Esri software to make a digital twin of the city, a virtual replica that uses artificial intelligence to explore how climate change and development interact.
"This data really helps us from a large, citywide perspective to think about how much money we have, how much time and resources we have and really helps us prioritize those areas where people are going to need it the most," said Megan Anderson, Raleigh's sustainability director.
This system can create a model to show how a new road or building would impact the city, by blocking wind or absorbing more heat, and how that could change as temperatures rise.
"Raleigh is one of the fastest growing cities in the country," Anderson said. "We're going to continue to see climate change happen and urban heat strategies might need to change as our development continues to change."
Raleigh plans to use the AI models to prioritize mitigation measures, such as where to plant trees or install cool pavement roadways, and even play out which measures would have the greatest cooling effect.