Weather
Dropsonde Profiles
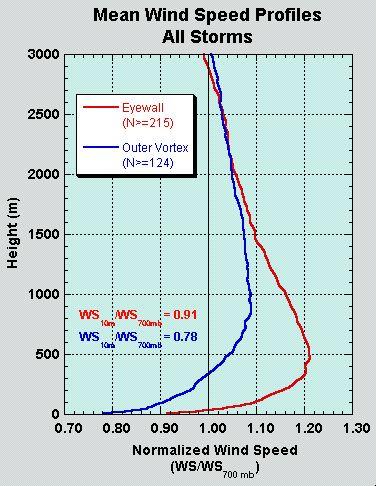
Mean distribution of hurricane vertical winds in the lowest 3 km based on dropsonde readings from 17 different storms. Note the value is normalized by dividing all wind speeds by the wind at 3 km. Red denotes the eyewall area and blue locations outside the eyewall.