
It's a little difficult to add much to the coverage you've probably seen on the supercell thunderstorms and associated tornadoes that tracked northeast early on Saturday, mainly along the I-95 corridor over eastern parts of our viewing area, but I thought I would provide at least a little amplification on the warnings involved, some climatological perspective and a few links where you can pursue additional information.
To begin with, I would note that while many tornadoes in North Carolina are very weak and have very brief lifetimes and short touchdown tracks, this event involved a couple of supercell circulations that produced some downburst wind damage and also multiple tornado tracks that ranged in intensity from EF0 to EF3 on the Enhanced Fujita scale. While many of the tornadoes that occur in our state allow for relatively little warning, these cells did produce rather deep mesocyclone circulations that could be identified and tracked on a relatively continuous basis using Doppler radar. We were able to find readily identifiable signatures to follow along as the event unfolded, and Greg was able to point these out on the air as the even progressed. During the early part of the storms' tracks, it was impossible to be certain whether the radar signatures corresponded to real damage occurring on the ground, but the potential certainly appeared to be there, and as local reports began to filter in it became more and more apparent that this was a dangerous situation to those in the path of the storm cell.
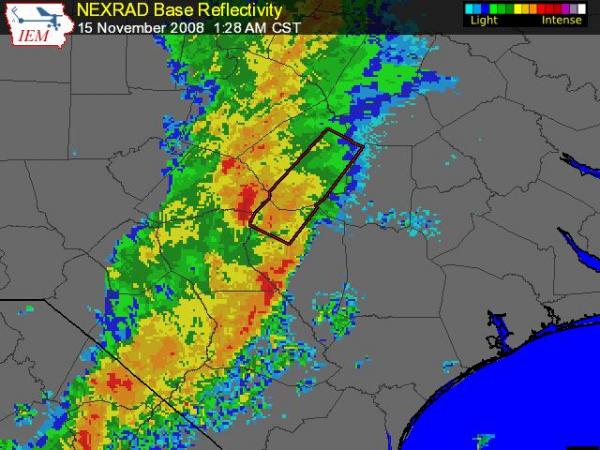
The consistency of the radar presentation with this storm also helped our National weather Service colleagues at the Raleigh forecast office to do an outstanding job in issuing and updating the warnings that we pass along to you by way of the web, crawls at the bottom of our screens, and during extended cut-ins like the ones Greg (and later Elizabeth) did on Saturday morning. There is a web site available that verifies the warnings versus actual reports of storm damage, computing statistics like lead times, likelihood of detection of a tornado and the rate of false alarm warnings, etc, and a check of that site shows that the average lead time between the warning and the occurrence of severe weather at a given point in this event ranged about 18-22 minutes. Especially notable was the a warning that extended to the Kenly area (shown in the first image above on a radar background from the time the warning was issued) which was put out 44 minutes before the EF2 funnel hit the Kenly area. It is very unusual in our state to have that kind of lead time. A later warning that was issued to cover much of Wilson County is shown in the second image. In this case, the warning was issued 22 minutes before the occurrence of EF3 damage near Elm City. It's worth noting in looking at those images that all of the affected area had been under a tornado watch since a little after midnight, and that the warning areas are outlined with polygons that are used in the "storm-based" system the NWS has implemented in the past few years, rather than warning entire counties as was previously the case. Here, using the polygons results in only about 30% of the area being warned than would have using the county-based system, reducing the area under a false alarm.
Of course, the timing of these storms was such that warnings may not easily reach many people, who would have been asleep and unaware of any TV or standard radio coverage. This is where alert systems like NOAA weather radio with Specific Area Message Encoding (SAME, which currently still operates on the entire county-based warning system) and mass-dialing systems like reverse 911 and WeatherCall can help when implemented.
Coverage of these storms has made note on-air and in the newspaper of past November tornadoes that swept through at night and produced fatalities, which has raised some questions about the number of tornadoes in November and why so many tornadoes occur at night. A look at the third image above shows the monthly distribution of tornadoes in the Raleigh weather service coverage area, indicating the peak in tornadic activity around here, by far, happens in the Spring (March through June), but also shows the second smaller uptick in numbers around October and November associated with both passing tropical systems (which spun off the Reigelwood tornado in Columbus County two years back) and the onset of late Fall-early winter frontal systems and the strong temperature contrasts and wind shears they bring. Another graph from the same document (available from the Raleigh NWS at the link to the right) traces the time of day of tornadoes in the area, showing well over 50 percent occur in the afternoon and early evening, with a much lower number during the night. It's interesting that those figures are based on tornadoes from 1950-2002, while a related graph on a Storm Prediction Center severe weather climatology page covering the period 1980-2006 is skewed somewhat more to the late afternoon to midnight range for a peak in tornadoes. Whether this is a change in the climatology involved in later years or a reflection of the fact that nighttime tornadoes are more likely to be detected with newer radar technology and were more likely to go completely unnoticed in the 1950s and 1960s is an interesting question.
Speaking of the Storm Prediction Center climatology data, that is a nice resource that has been recently added. There is a link to the right, and I've included a couple of graphics from there that plot (first) every severe weather report over the Raleigh radar coverage area for the 1980-2006 period and (next) a filtered plot that only shows F2 and above tornado tracks, along with wind gusts higher than 73 mph and hail larger than 2 inches in diameter, which they class as "significant" severe events most likely to cause damage or injury. The tendency of tornadoes to develop here when strong upper level troughs are just to our west, producing a tornado motion toward the northeast (40-45 mph in the case of Saturday night's event) is clearly evident.
Lastly, an interesting calculation is made on the site which works out the probability of a tornado at any point within that Raleigh radar coverage area being struck by a tornado in any given year, and the associated return interval, or frequency with which a tornado might be expected at that spot. As with any statistics, they immediately become meaningless in some ways when a tornado does strike a given location. At any rate, for our area they came up with a probability of an F2 or stronger crossing a given point as .023%, which equates to one tornado every 4351 years.
Copyright 2024 by Capitol Broadcasting Company. All rights reserved. This material may not be published, broadcast, rewritten or redistributed.


