
While we've managed to avoid records and extremes for the past week or two, we have been hot across the area, and we're heading into our 9th day in a row with temperatures in the 90s at the RDU airport. We're likely to add two or three more days to that stretch before our next departure toward more moderate readings, but of course twelve days or so of consecutive highs at 90 or above isn't a historically extreme circumstance here. Our record for most 90+ readings in a row at RDU is 24 days from July 14 to Aug 6 in 1995, and of course just last year in August, every day but one reached that threshold, including 20 days in a row.
Over the next two days, our current warm stretch should reach a peak, as an upper level ridge just to our west extend into the eastern U.S. and helps push highs across central NC into the upper 90s to around 100. That will put us right in the range of current record levels for the RDU airport, which currently stand at 100 for Tuesday (Aug 5th) and 97 for Wednesday (6th). Our forecast highs for those days are 99 and 97, so it's too close to call at this point as to whether we will end up setting or tying one or two records, or falling just shy on both days.
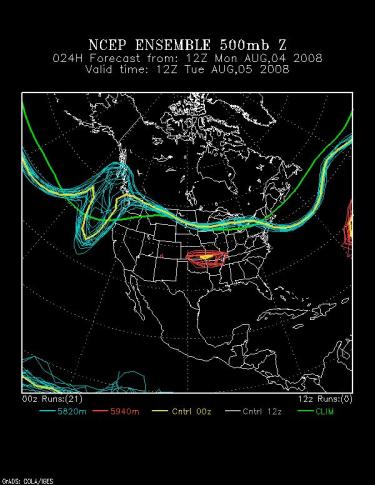
In any event, it appears there will be a notable pattern shift later this week and into early next week that should moderate our temperatures nicely. That comes in the form of a significant upper level trough that is forecast to develop across the eastern sections of Canada and the U.S., with an attendant drop in temperatures for the eastern third or so of both countries. Some of the attached images from NOAA's Climate Diagnostics Center illustrate this. The first is a "spaghetti" plot showing a couple of selected height contours for the 500 millibar pressure surface, pretty much the equivalent of looking at isobars about 18,000 feet above the ground. Generally, where this bows toward the north (and a little to the east of that ridge axis) or is especially high in a center, we tend to see temperatures run above normal. The first image shows the pattern for 8 am Tuesday, with the small red circle to our west marking an above height centered there. The second image shows the forecast for Sunday morning, and you'll note a significant change, with a fairly deep trough, or dip in the line, over eastern North America as well as the disappearance of the high center previously to our west. By the way, a "spaghetti" plot like these shows results from a number of different forecast runs from a single model, each run initialized with data that is "perturbed" slightly to simulate the effects of imperfect measurements that can have important effects as the forecast calculation progresses. When the multiple lines all coincide closely through time, there's at least some reason to have more confidence in the results, while a chaotic jumble of lines after a few days implies initial conditions that are highly sensitive to small errors in the initial analysis, or a relatively unstable (and unpredictable!) pattern that makes forecasts more suspect.
At lower altitudes, the next two images show the same time frames, with contours of the expected difference of temperatures at about 5000 feet from their normal values for this time of year. Tuesday morning, we are within the eastern edge of an area of above normal temperatures, while by Sunday we are within the southern portion of an area of below normal values.
Given those changes in the pattern, a map of expected departures of surface temperature from normal, from the Climate Prediction Center, indicates a pretty good change of below normal readings for much of the eastern U.S. through the period centered around this weekend. So far, it appears we'll only run a few degrees shy of normal , but even stretch of mid 80s is a nice break after 10 or 12 days above 90 and a couple near triple digits!
Copyright 2024 by Capitol Broadcasting Company. All rights reserved. This material may not be published, broadcast, rewritten or redistributed.


