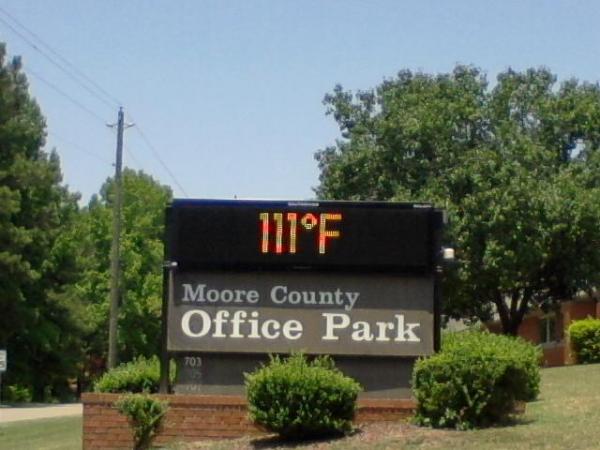
Fishel uses scientific method to test heat hypothesis
When one predicts the hottest temperature on record for a given location, it is prudent to examine as many angles as possible to make sure that forecast has a chance of coming true.
Posted — UpdatedWhen one predicts the hottest temperature on record for a given location, it is prudent to examine as many angles as possible to make sure that forecast has a chance of coming true.
The scientific method states that you begin with a hypothesis, then test that hypothesis via research and finally formulate a conclusion. Some have stated this somewhat differently in that one should set out to disprove their hypothesis, and only after failing to do so does one equate the conclusion with the hypothesis.
So our hypothesis states that the all-time hottest temperature at the RDU airport (105F) will be broken on June 29, 2012. Now for that dreaded research! One of the ways we examine the warmth (or lack thereof) of the atmosphere is by looking at the distance between two constant pressure surfaces. In other words, you measure the distances you have to travel upward to reach two specific pressures and then calculate the distance between them. We call this value a thickness. The higher the thickness, the warmer the air is throughout that layer.
So, I went back and looked at all the days at RDU where the surface temperature reached either 104 degrees F or 105 degrees F. There were 12 such dates. I then looked at the thickness values observed the evening of the day in question. Here are those values:
Here are predicted values from the GFS Global Model Output:
Only Aug. 18, 1988, has a higher value than what is projected for Friday and Saturday evening. Admittedly, that is one of the days we hit 105, but all of the other dates here had lower values than what we are projecting.
Another parameter we look at is the temperature at 850 millibars, or a height of approximately 5,000 feet above sea level. During the day as the sun warms the earth's surface, a deeper and deeper layer of the atmosphere becomes what we call "mixed," and if you have a good idea as to what the temperature at 850 millibars will be, you can project the surface temperature. Let's take a look at the evening values of the 850 millibar temperature for the same set of dates:
Here are predicted values from the GFS Global Model Output:
As you can see, none of the prior 12 dates have 850 millibar temperatures as high as the ones projected this weekend.
There are other ingredients that go into this forecast, such as the amount of soil moisture and the direction of the wind in the lowest 5,000 feet of the atmosphere, but clearly the atmosphere over central North Carolina this weekend is in very select company, and with any luck at all, we will rewrite the history books when it comes to the date of the highest temperature ever recorded at the RDU airport. Stay cool!
Copyright 2024 by Capitol Broadcasting Company. All rights reserved. This material may not be published, broadcast, rewritten or redistributed.


