
By Mike Moss
Now that the new year is upon us, the numbers are out for the month of December at Raleigh-Durham, as well as some of the yearly totals for 2006.
As you no doubt realized, this December was on the warm end of the scale for our area, and in fact turned out to be the fifth warmest recorded there, with a monthly average temperature of 47.8 degrees. This compares to a normal for December of 43.0 degrees, and also represents a big jump from one year ago, when December ended up a cooler-than-average 40.7. In the course of averaging out above normal, we ended up reaching record territory at each end of the scale once during the month, with a record-tying low of 16 degrees on the morning of the 9th and a new record high of 71 on the afternoon of the 17th.
Precipitation for the month totaled 3.0 inches, all in the form of rain, which is very close to normal (just 4 hundredths shy). It was also a month in which the rainfall came in very concentrated bursts, with record amounts of .94 inches on the 22nd and 1.51 inches on the 25th accounting for a large part of the monthly total.
December also finished out a year than ended up considerably wetter than normal overall, in spite of a period of drought conditions during the spring and early summer. Total rainfall for the year at RDU was 53.69 inches, 10.64 inches above the normal value and far above our 2005 value of 37.55 inches.
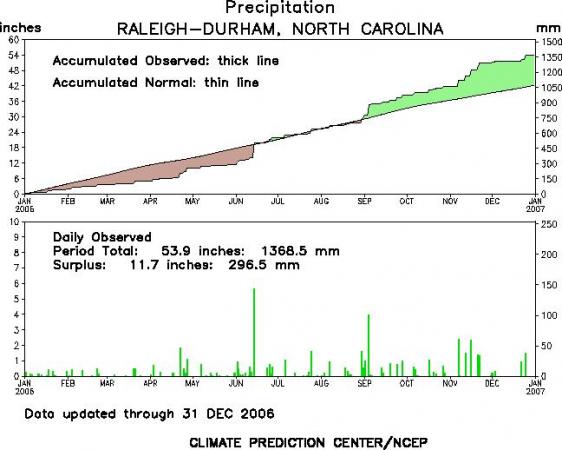
The image you see above is a bar graph of daily rainfall totals for 2006 (bottom chart) and a line graph (top) showing the accumulated yearly rainfall compared to the normal cumulative values. You can clearly see how dry the first part of the year was, and how we made up a lot of ground with a wet June, then ran well above normal the rest of the year with help from another very wet period around the beginning of September. The chart shows slightly different numbers for the yearly total and departure from normal (surplus) from those I cited above. This is likely due to the automated processing used by the NOAA Climate Prediction Center to produce the graph, while the numbers above come from the Raleigh NWS office and probably include some corrections and adjustments that are not reflected in the graph.
Copyright 2024 by Capitol Broadcasting Company. All rights reserved. This material may not be published, broadcast, rewritten or redistributed.


