
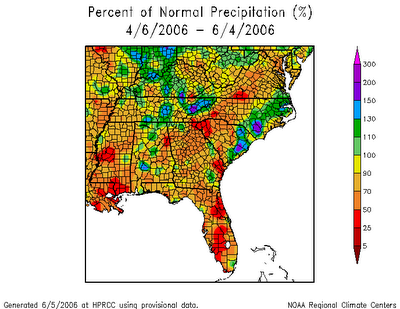
That's not a reference to a limbo team, but instead to streamflow over western parts of North Carolina and of the WRAL coverage area. For many of us, periodic shower and thunderstorm activity, including about a tenth to a quarter inch of rain last night from a passing cluster of showers associated with an upper level disturbance moving around the southern periphery of an upper low north of us, has brought our rainfall much closer to normal over the past couple of months, even exceeding normal for eastern parts of the region. However, in general there has been a striking difference in rainfall amounts as compared to normal as you go from west to east. This is illustrated in the map below, from the Southeast Regional Climate Center's precipitation and temperature mapping page. The color-coding on the image below shows rainfall in the 110-200% range over the past 60 days for the coastal plain, a good portion of Wake County and much of the Sandhills, but a rapid transition to amounts in the 50-90% range farther north and west.
While the rains have helped with lake levels and with lush green vegetation for many of us, the lack of rain over the western Piedmont and into the foothills continues to have a significant effect on streamflows, as indicated in the next map, from the US Geological Survey (you can check for real-time updates and specific data for the gauges mapped below at this link). Here the dark red circles indicate streamflow measurements that fall into the lowest 10% of measurements at that point for this date in the past, while the yellow-orange indicates flows between the lowest 10 and 24% of historical readings. Greens and blues indicate normal to above normal flows and are more prevalent across southern and eastern parts of the state. The hit and miss nature of locally heavy thundershowers leads to some variability, of course, and this is especially notable across the Triangle region. The Eno river flows past gauges at Hillsborough and Durham, with the current reading at only the 9th percentile at Hillsborough, while at Durham the flow stands at the 23rd. These distributions of rainfall and streamflows will be something to watch as we head on into the summer, since some of the lower streamflows are in locations that contibute inflow to Jordan, Falls and Kerr Lakes...


 for 2024 season")


