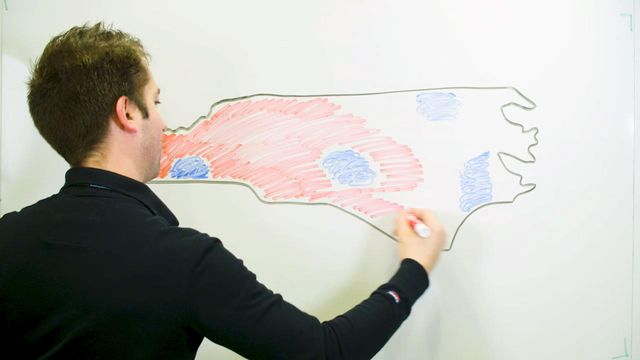
How fair are NC's voting maps? Check the math
A team of mathematicians at Duke University set out to find a way to analyze maps to determine was was fair and what wasn't. Here's what they found, explained.
Posted — UpdatedPolitical maps have come a long way since 1812, when a newly-drawn, salamander-like district in Massachusetts invoked the ire of voters. Judges have found that a district doesn't have to look monstrous to qualify as unconstitutional, especially given the capabilities of mapmakers to use computational power to precisely slice and dice a state into pieces more favorable to Democrats or Republicans.
But where you draw the line on gerrymandering is a matter of debate so hotly contested it's currently before the U.S. Supreme Court.
Related Topics
• Credits
Copyright 2024 by Capitol Broadcasting Company. All rights reserved. This material may not be published, broadcast, rewritten or redistributed.


